Find out what is happeningbefore it shows up in your bank balance.
Revenue, bookings, cancellations and staff, compared against the period before.
A real moment
The Friday slot that was quietly costing you
Revenue is flat and you cannot say why. Bookings are actually up. But cancellations doubled, and the reason at the top of the list is the same Friday evening slot people keep dropping. You stop offering it, move those visits to Saturday morning, and the next month reads clean. Nothing about that was visible from the calendar.
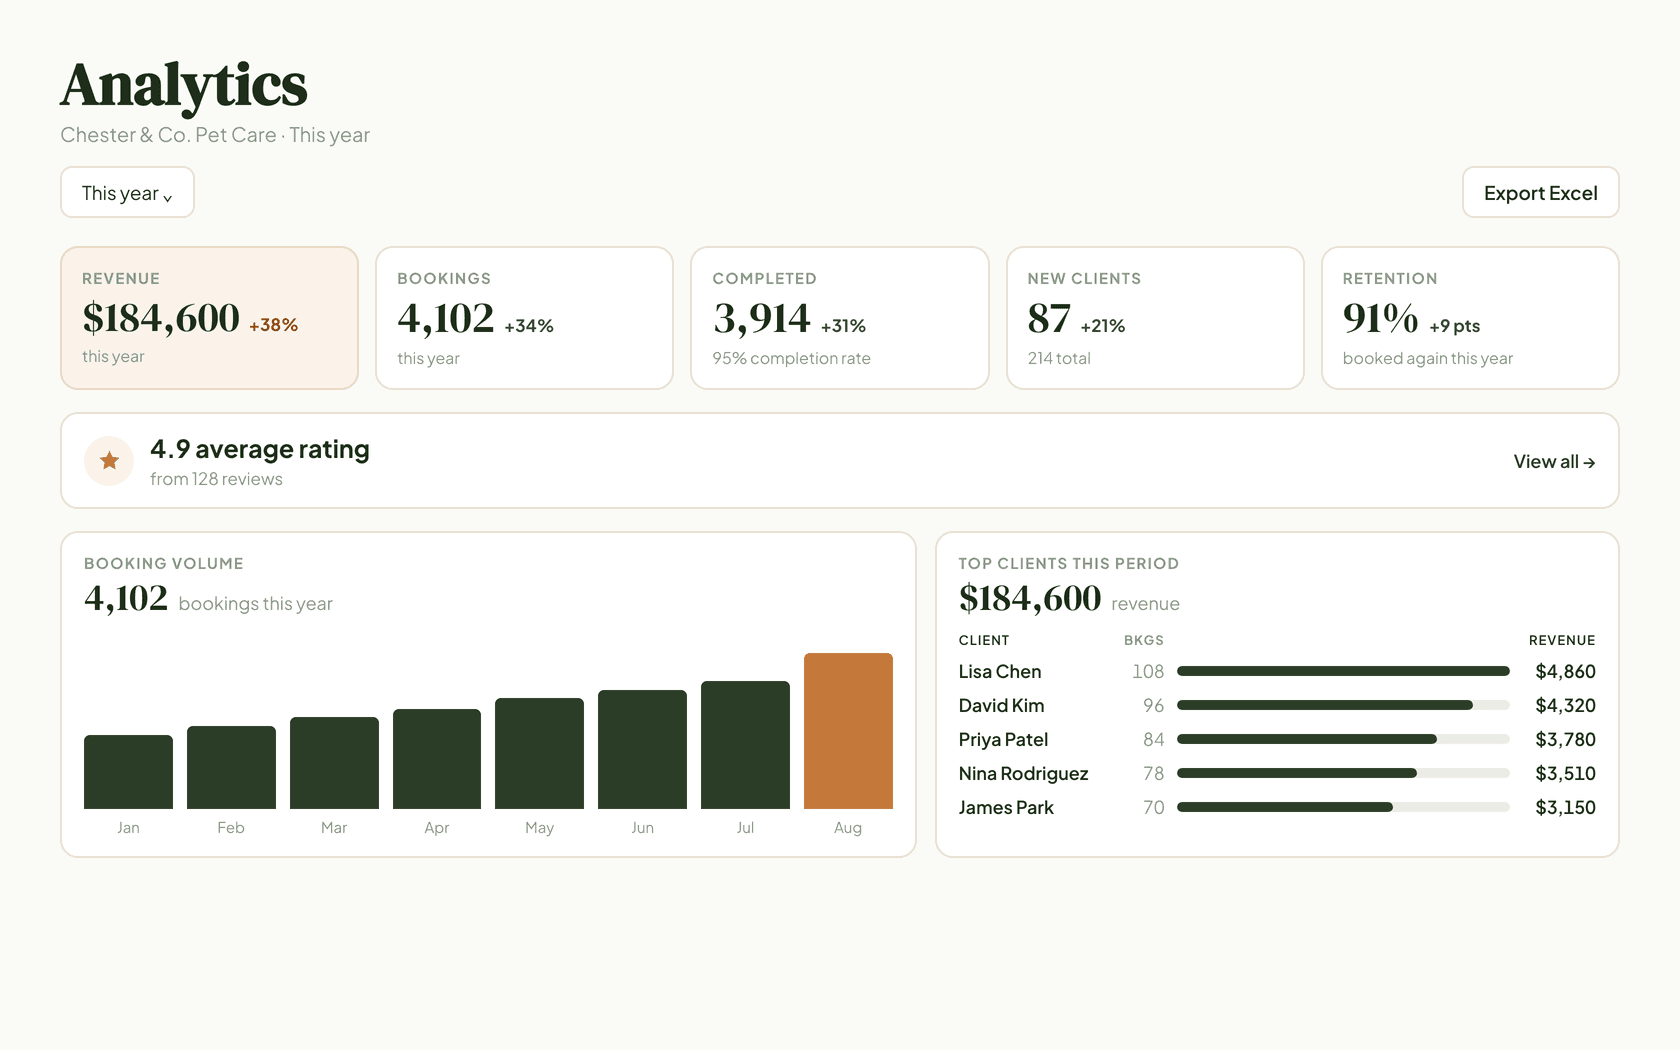
Compared, not just counted
Every number sits against the period before it, so you can tell a good month from a normal one.
Cancellations get a reason
Broken down by cause and by day of week, which is where a pattern actually shows up.
It leaves in a format your accountant wants
The whole workbook exports, and tax-prep CSVs are ready when filing is.
Everything Analytics & Reporting does
- Revenue reporting across any period you choose
- Booking volume over time
- Period comparison: this period against the one before it
- Cancellation tracking with top reasons
- Cancellations by day of week
- New client and client-health tracking
- Average rating across your reviews
- When you work: your busiest days and time slots
- Service mix by count and by revenue
- Staff performance reporting for teams
- Excel export of the full analytics workbook
- Tax-prep CSV exports for your accountant
Analytics is available on the web app. There is no analytics screen in the mobile app today.
Ready to Try Analytics & Reporting?
Get started free. No credit card required.